Dashboard monitoring
Track integration health, metrics, and issues in the Data Partner Dashboard
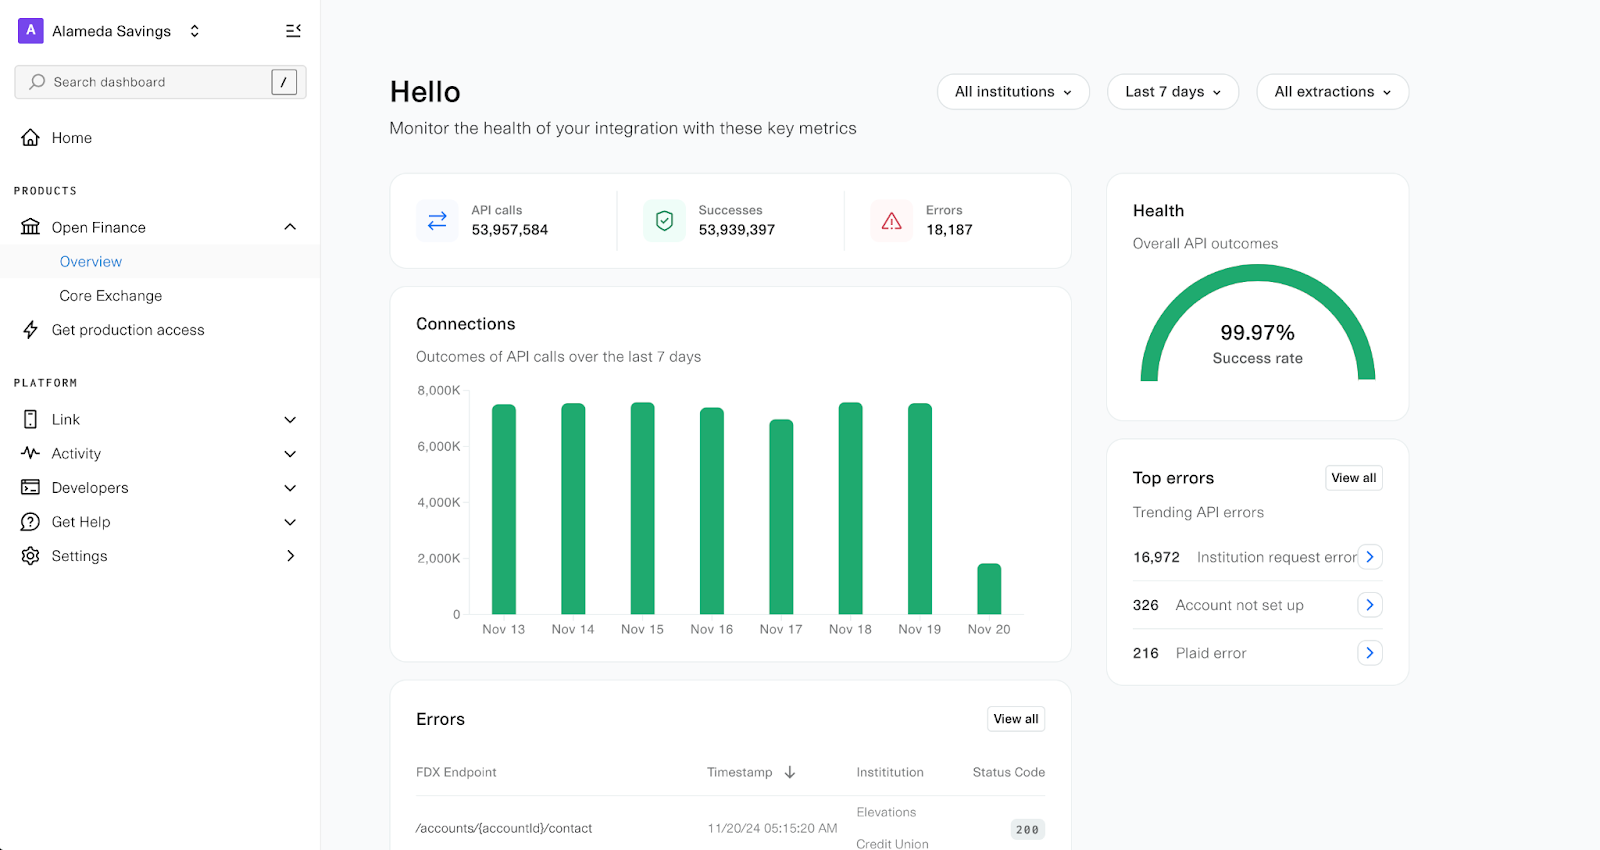
Integration metrics and health
Once your integration is live, the Overview page in the Data Partner Dashboard provides real-time health metrics. These metrics are not visible until production traffic is enabled.
Conversion rate
- What it measures: How often users who select your institution successfully complete account linking. This metric covers activity between institution selection in Plaid Link and handoff back to Plaid.
- Formula: (Number of Link sessions that reach handoff) / (Number of institution selects in Link)
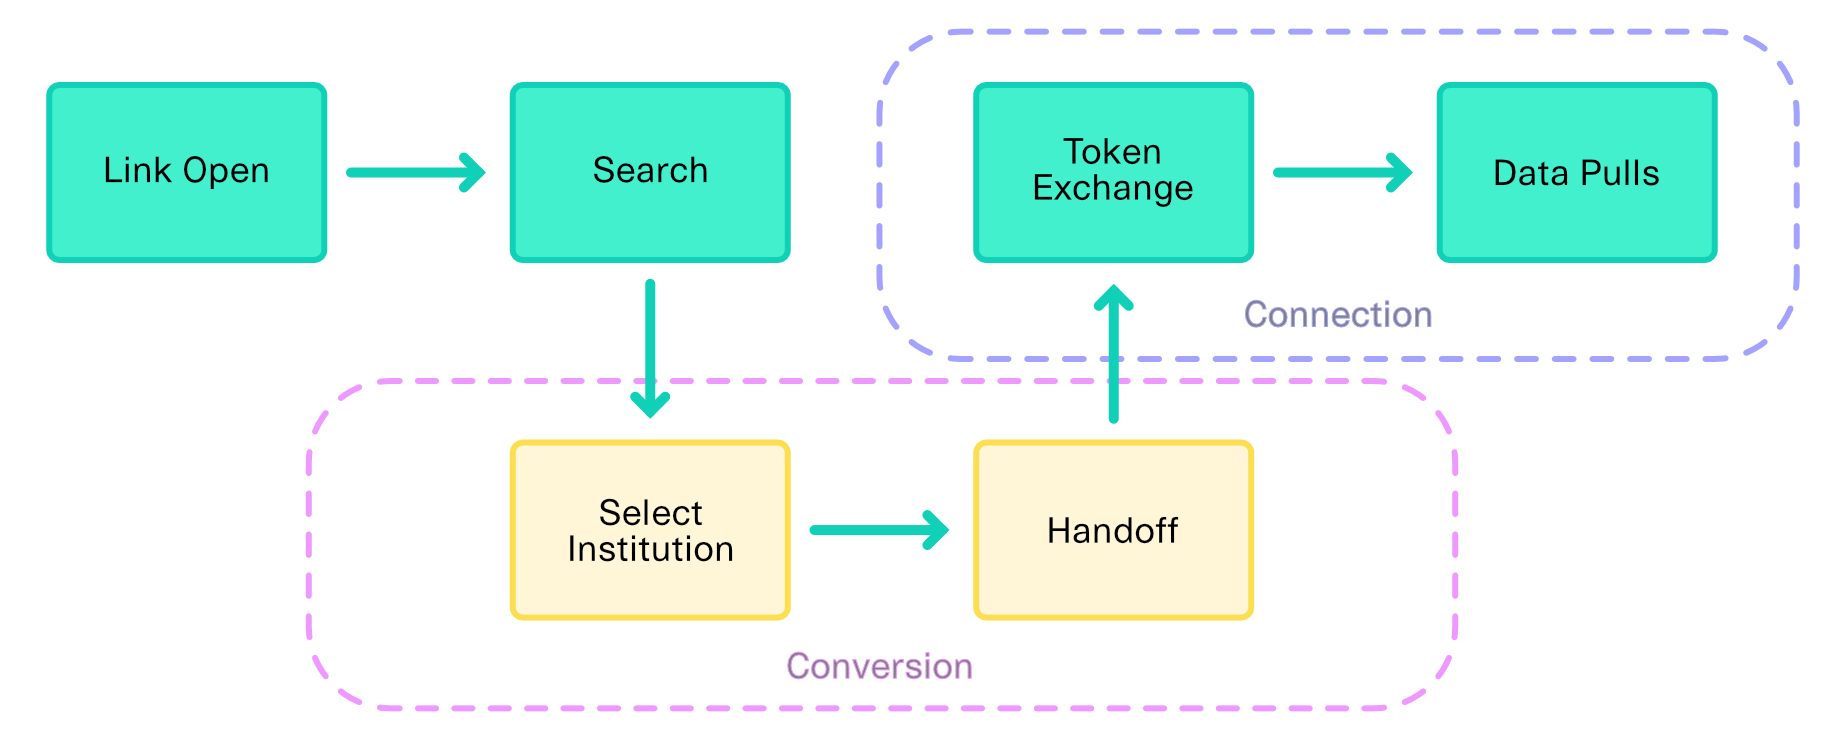
Connection health
- What it measures: The overall success rate of Plaid's data extractions from your API after an account has been linked. Unlike conversion rate, connection health focuses on post-Link activity and is evaluated at token exchange and data pulls.
Traffic types
Plaid sends two kinds of traffic to your API:
- User-initiated traffic: Triggered when a user is actively going through a login or update flow. Account and transaction data are pulled in real time and made available to apps.
- Batch traffic: Scheduled, automated requests that keep financial data (for example, transactions and balances) up to date even when the user is not active.
Result classification
- Success: Plaid did not encounter any errors during data extraction while interacting with your API.
- Error: Plaid encountered an error at any point during data extraction. While many errors come from non-200 responses from your API, certain 200 responses can still be classified as errors if the extraction fails.
Health score
The proportion of successful data extractions across your API's data resource endpoints:
(Number of successful extractions) / (Total extractions)
Performance
- Uptime: Calculated as the percentage of successful and client-error responses (HTTP 2xx, 3xx, and 4xx) out of all received responses, excluding scheduled downtime (as indicated by FDX 503 errors).
- Latency: The round-trip response time when Plaid calls your endpoints from the
us-east-1(Virginia) region.
For target metric values, see Post-launch operations.
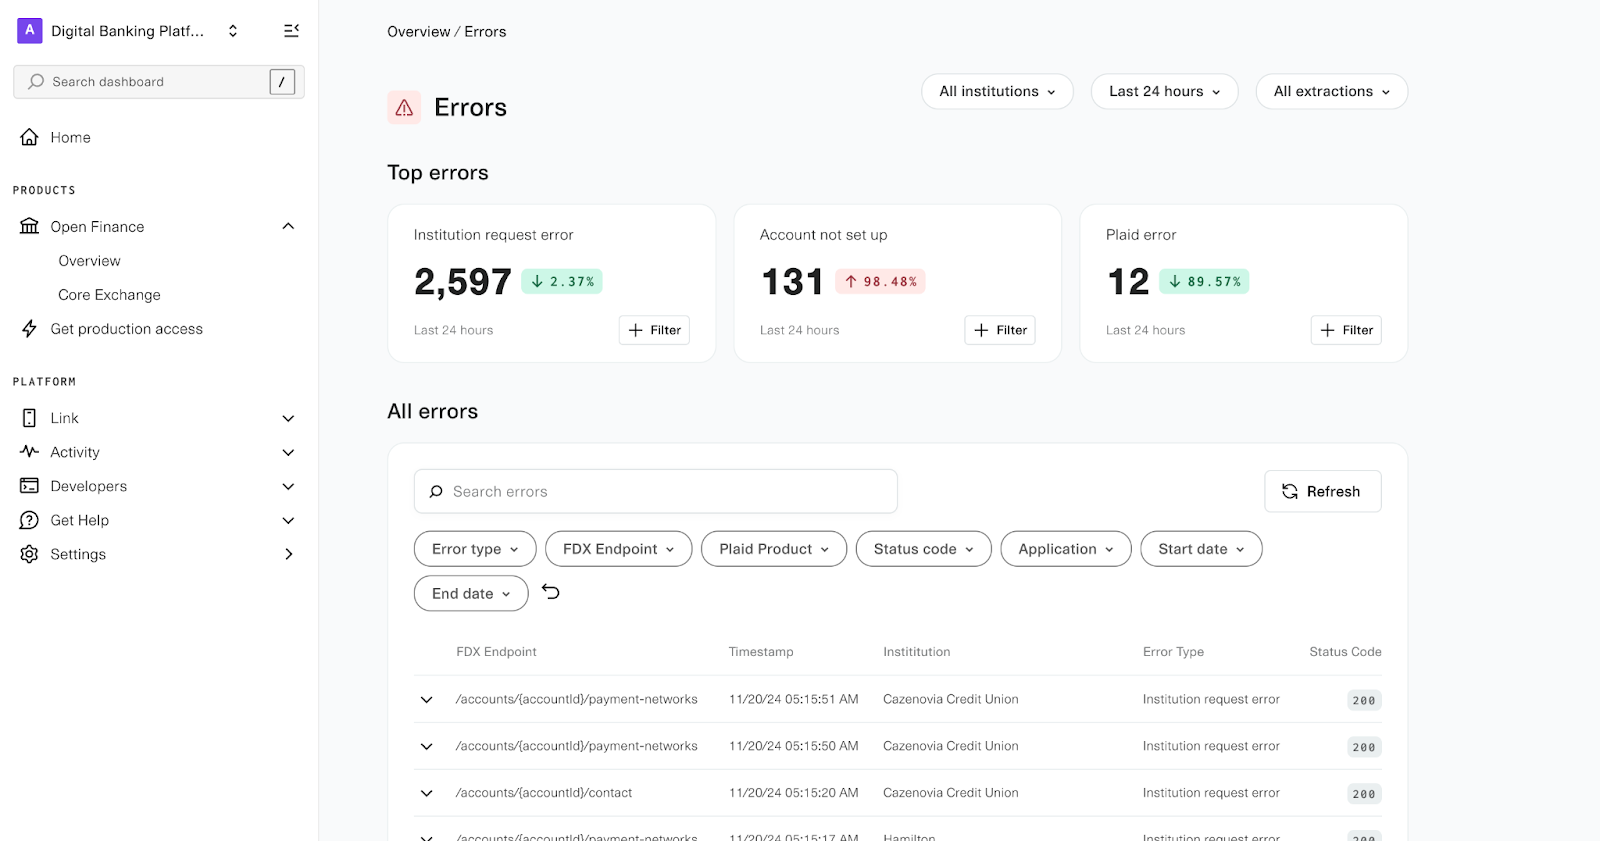
Detailed logs
Click View all to see detailed logs of all errors encountered during data extraction.
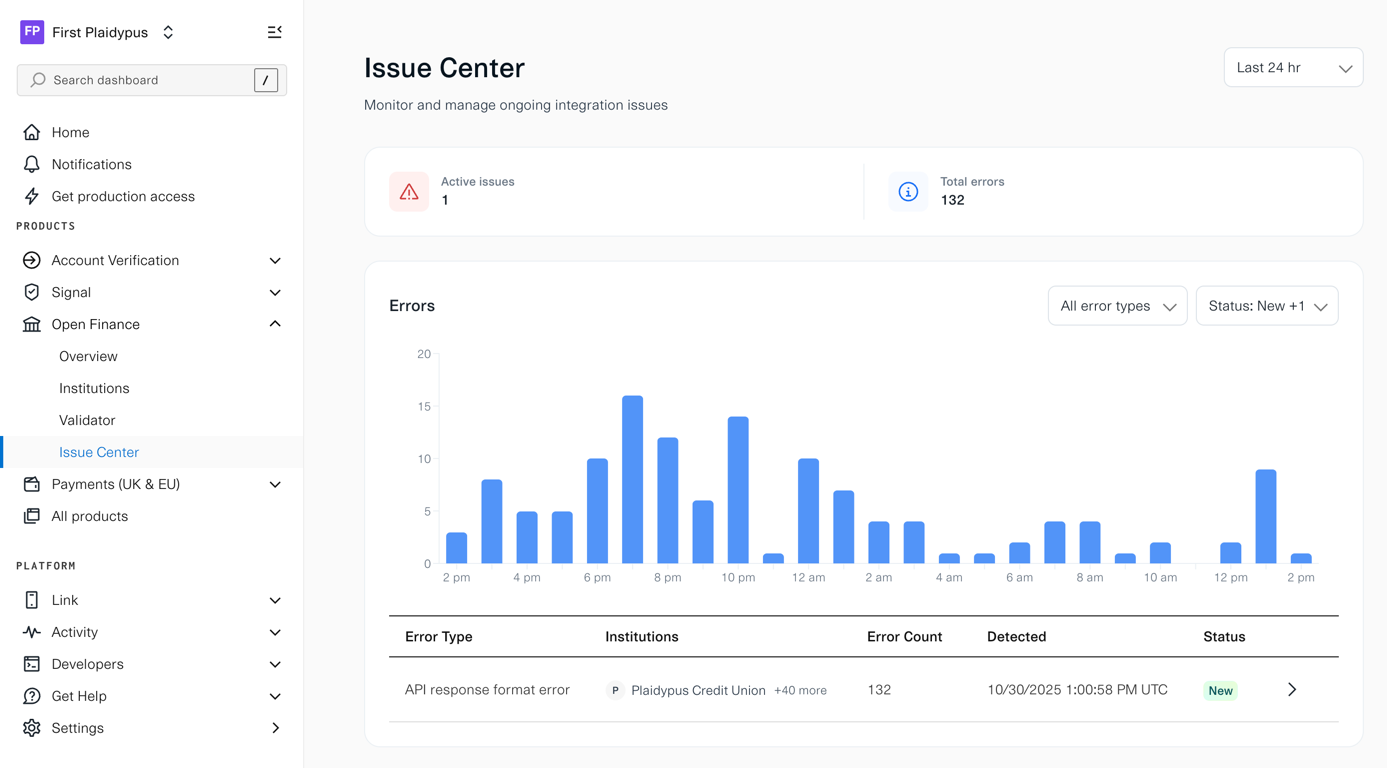
Issue Center
The Issue Center allows you to monitor and resolve integration issues that Plaid detects across your Core Exchange connections. When a new issue is detected, Plaid sends an email alert with a link to the issue in your dashboard. To access the Issue Center, navigate to Open Finance → Issue Center in the sidebar.
Issue Center page
The Issue Center page provides an overview of all active integration issues. Summary cards at the top display the total number of active issues and total errors. A bar chart shows error volume over time, with filters for error type, status, time range, and institution (platforms only).
The main table lists each issue along with affected institutions, error count, detection date, and current status. Click any row to open the detail page for that issue.
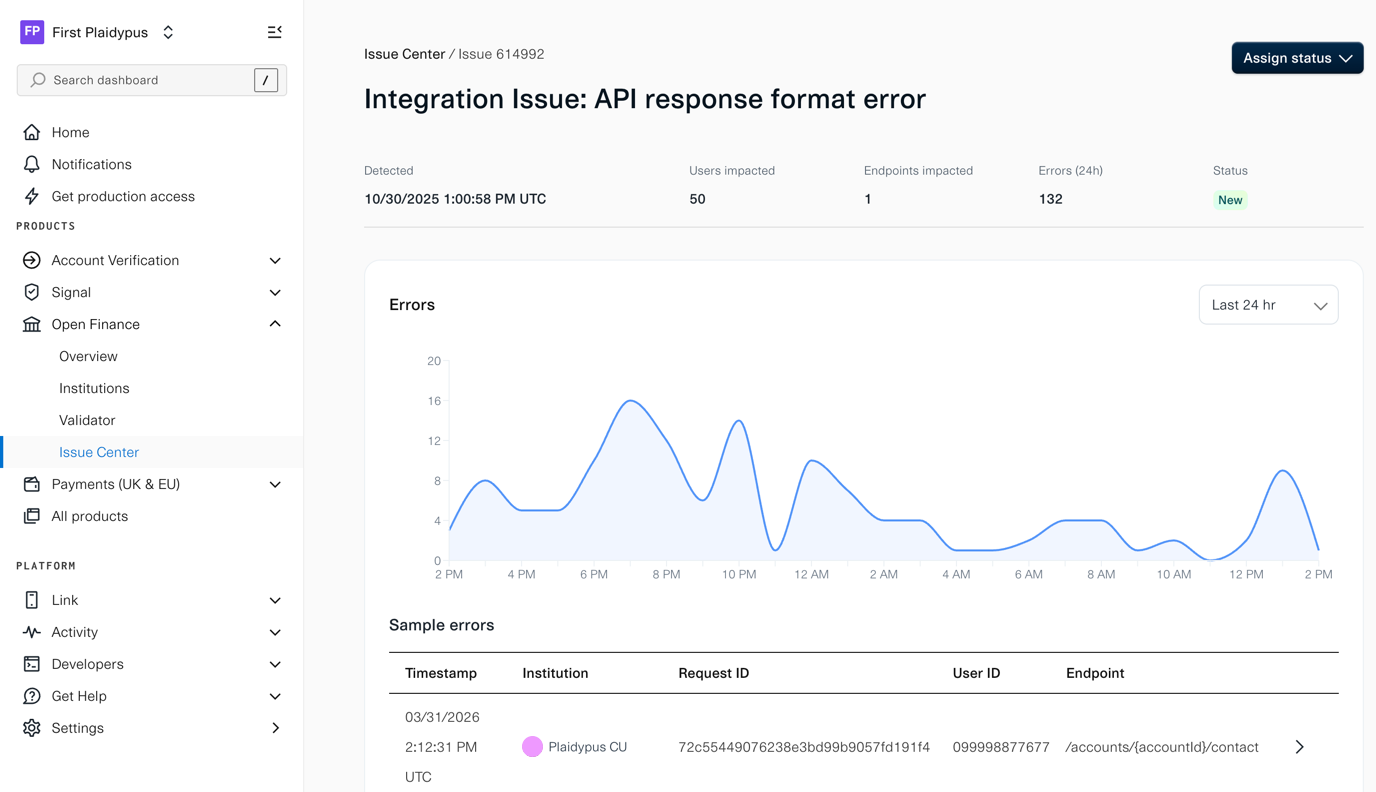
Issue detail page
The issue detail page shows the full context for a specific issue, including:
- Detection timestamp
- Number of impacted users and endpoints
- 24-hour error count
- Current status
- Error trend over the last 24 hours or 7 days
The Sample errors section lists individual occurrences with the timestamp, institution, request ID, user ID, and endpoint. Use these details to cross-reference with your server logs. Use the Assign status button to update the issue as your team triages and resolves it.